tNavigator offers a powerful engineering tool for field development strategy analysis and production optimisation, providing true integration between the reservoir and surface facilities.
Reservoir models with different PVT properties can be coupled and controlled by the surface elements in order to run the forecast and account for all elements of the production system. Run the model faster, saving time for analysis and decision making.

Well Modelling
Design and visualise well models in an interactive interface with advanced tools for editing well geometry and construction. Integrated workflows allow each VFP project to be linked back to corresponding well in the dynamic model, and provide unified fluid properties and PVT models across your project.
- Calculate pressure drop and fluid flow patterns using multiphase flow correlations
- Calculate VFP tables with the option to add experimental data.
- Incorporate inflow control devices
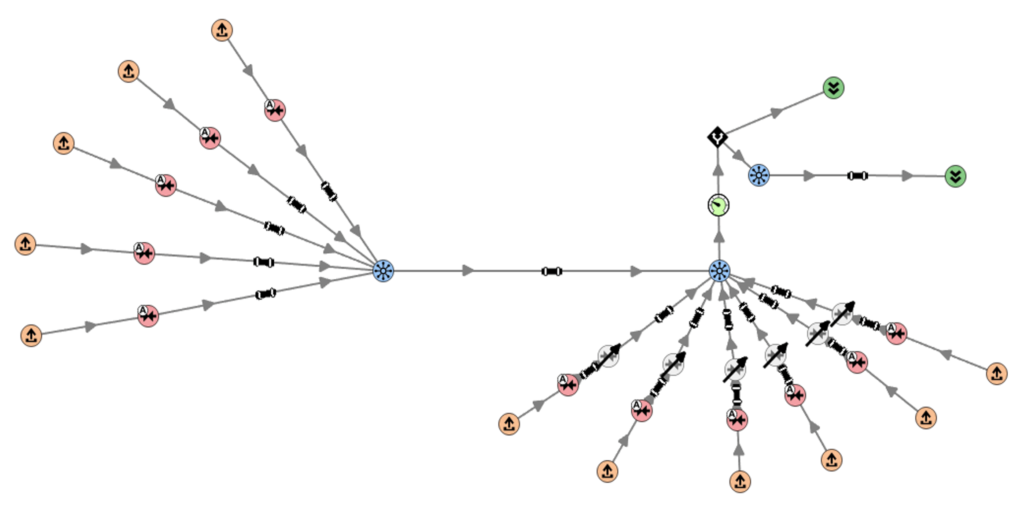
Network Modelling
Build and edit surface network models, with an extensive library of elements available. PVT tables and well design can be incorporated into the model, to allow for calculation of pressure and temperature distribution.
- Create and edit surface networks using wide range of elements such as wells, pipes, separators, chokes, pumps, compressors & constraints.
- Calculate pressure and temperature distribution for steady-state flow conditions;
- Integrate PVT tables and compositional models (EoS blending);
- Integrate with well models and automatic VFP and IPR updates
Integrated Asset Modelling
Tackle field development planning and production optimisation using an integrated approach, allowing you to incorporate all elements of the field into one project and calculate the system of equations fully implicitly.
- Create and run fully integrated models ( reservoir + wells + surface facilities)
- Coupled projects with unlimited amounts of connected reservoirs
- Unified Graphical user interface provides a synchronized visualisation for integrated models
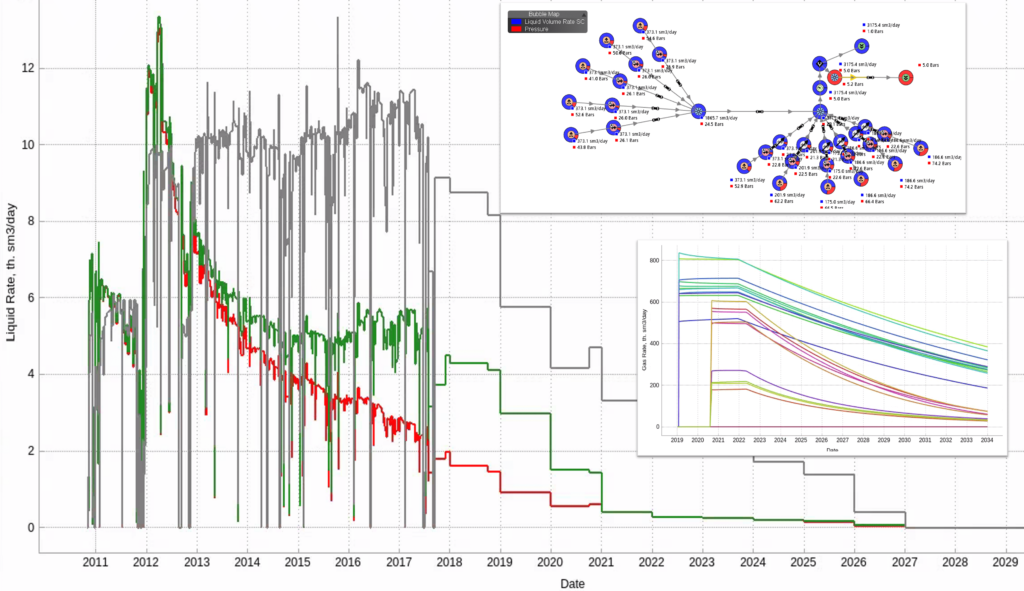
Results Analysis
Save valuable time without compromising on the depth of analysis and data interpretation. Results are viewed in a single multi-window graphical user interface offering interactive, on-the-fly visualisation for more informed, confident decision making.
- Visualisation of 2D and 3D maps and graphs during calculation;
- Graph templates, bubble maps, contours, cross plots, well profiles, VFP visualisation and reports